Blog

us.jpg   fr.jpg

Weight of Names in S&P 500 trading > 10x Trailing 12M P/S

image30.png

U.S. Real Estate Sector Index Trends (1996–2025)

image29.png

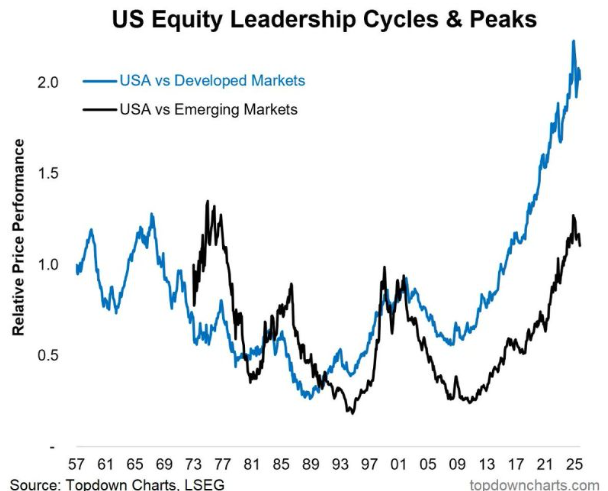
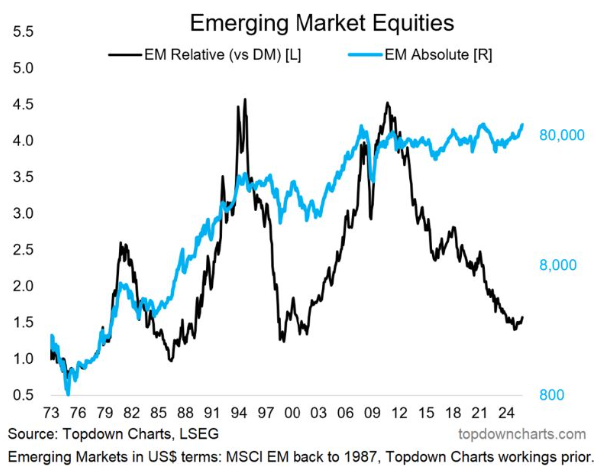
Emerging Markets vs Developed Markets

image28.png

Historical Active Fixed-Income Funds' Success Rate (%)

image27.png

Rolling 3-Year S&P 600 (Small Cap) Returns minus Rolling 3-Year S&P 500 (Large Cap) Returns

image26.png

Growth of $2000 Invested Annually in the S&P 500 from 2005-2024

image25.png

Global Housing Shortage

image24.png

Historical Active Equity Funds' Success Rate (%)

image23.png

US Equity index P/E valuations vs. history

image22.png

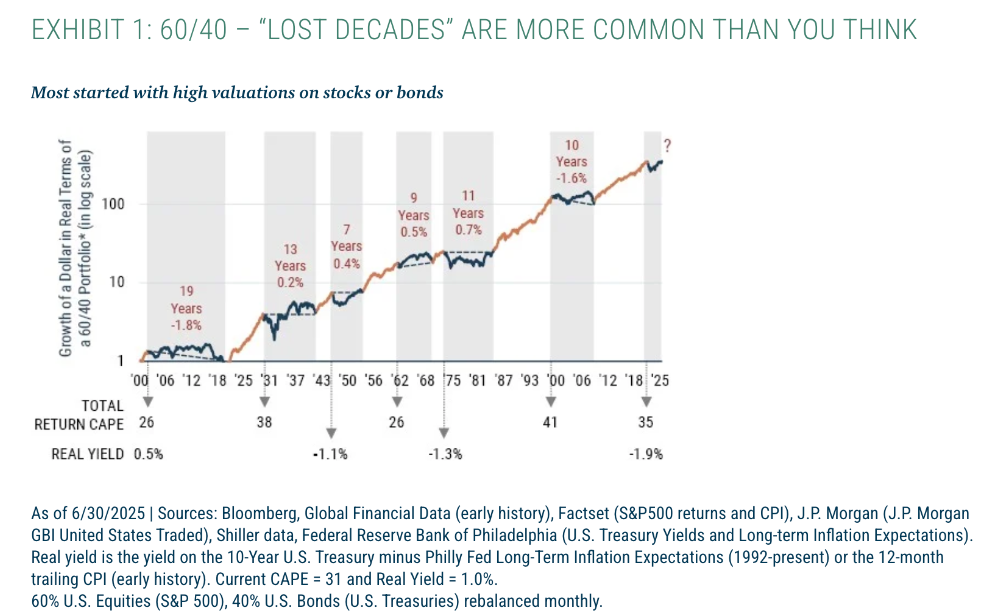
60/40 can have long periods of weak returns

image21.png

Syndicate content